Silver reached roughly $49.51 an ounce in 2011 during the post-financial-crisis commodity boom, then fell to about $12 during the March 2020 COVID-19 market panic, a round trip that erased nearly three quarters of its value, as the London Bullion Market Association's guide to precious metal benchmarks records. Nothing about the metal itself changed in those nine years. The screen changed, and every quote built on top of it changed with the screen.
That's the first thing to understand about the gold silver price you see on a phone or a shop wall. It's a wholesale reference, not a payout. A benchmark tells you what one troy ounce of pure metal is worth to the wholesale market at a particular minute, and what a ring, a coin or a pawn ticket settles at is a different number built from that reference after weight, purity, margin and terms are applied. What follows walks that gap in the order you meet it, from the chart to the counter, with the arithmetic shown at every step.
Spot, Buy and Sell Prices Explained
Walk into a grocery store and you'll meet two prices for a tomato without ever seeing the third. The farmer sells at a wholesale rate, the shop buys near it, and the shelf tag sits above both. Precious metal runs the same three-layer structure, except the wholesale number is published live and quoted in dollars per troy ounce.
Spot price is that wholesale number. It's the live market price for one troy ounce of pure metal, about 31.1 grams, which is heavier than the 28.3 gram ounce on a kitchen scale. Spot is quoted in U.S. dollars and it moves through the trading session, so the same ring can carry two different spot values an hour apart.
The LBMA benchmark is the professional version of the same idea. The LBMA Gold Price is struck twice each business day and the LBMA Silver Price once, both through administered auctions rather than nonstop trading. Gold averaged $2,386.20 per troy ounce in 2024, according to the London Bullion Market Association's annual forecast survey, which is a useful reminder that the reference itself drifts over years, not just minutes.
The buy price is what a shop pays you. It sits below spot because the shop carries the metal, the testing risk, the refining cost and its own margin until the piece sells or ships out. The sell price is what a shop charges the next customer. It sits above spot, covering the same costs plus fabrication and premium on finished pieces. Melt value is the pure metal content multiplied by spot, with no craft, brand or collectible premium attached, and it's the number most everyday jewelry trades against.
| Price type | What it measures | Who quotes it | Position vs spot |
|---|---|---|---|
| Spot price | Live market price per troy ounce of pure metal | Trading markets | Reference point |
| LBMA benchmark | Auction reference for unallocated metal delivered in London | London Bullion Market Association | Close to spot; gold set twice daily, silver once daily |
| Buy price | Amount a dealer or pawn shop pays you | Local shops | Below spot after margin |
| Sell price | Amount a shop charges to resell | Local shops | Above spot after premium |
| Melt value | Pure metal content multiplied by spot | Calculated from the price sheet | Equal to spot on pure metal only |
Two shops can quote the same spot on the same afternoon and pay you amounts that differ by a fifth, because the margin between spot and the buy price is a business decision rather than a market fact.
> The one question to ask: "Is that number your buy price, your sell price, or spot?" Until you know which of the three you're comparing, two offers aren't comparable at all.
Reading Live Charts and Benchmark Times
A chart can show a clear price while still being easy to misread. The axes identify what the number means: time runs horizontally, and price in U.S. dollars per troy ounce runs vertically.
The infographic below shows checks for reading a live chart before comparing it with an offer.
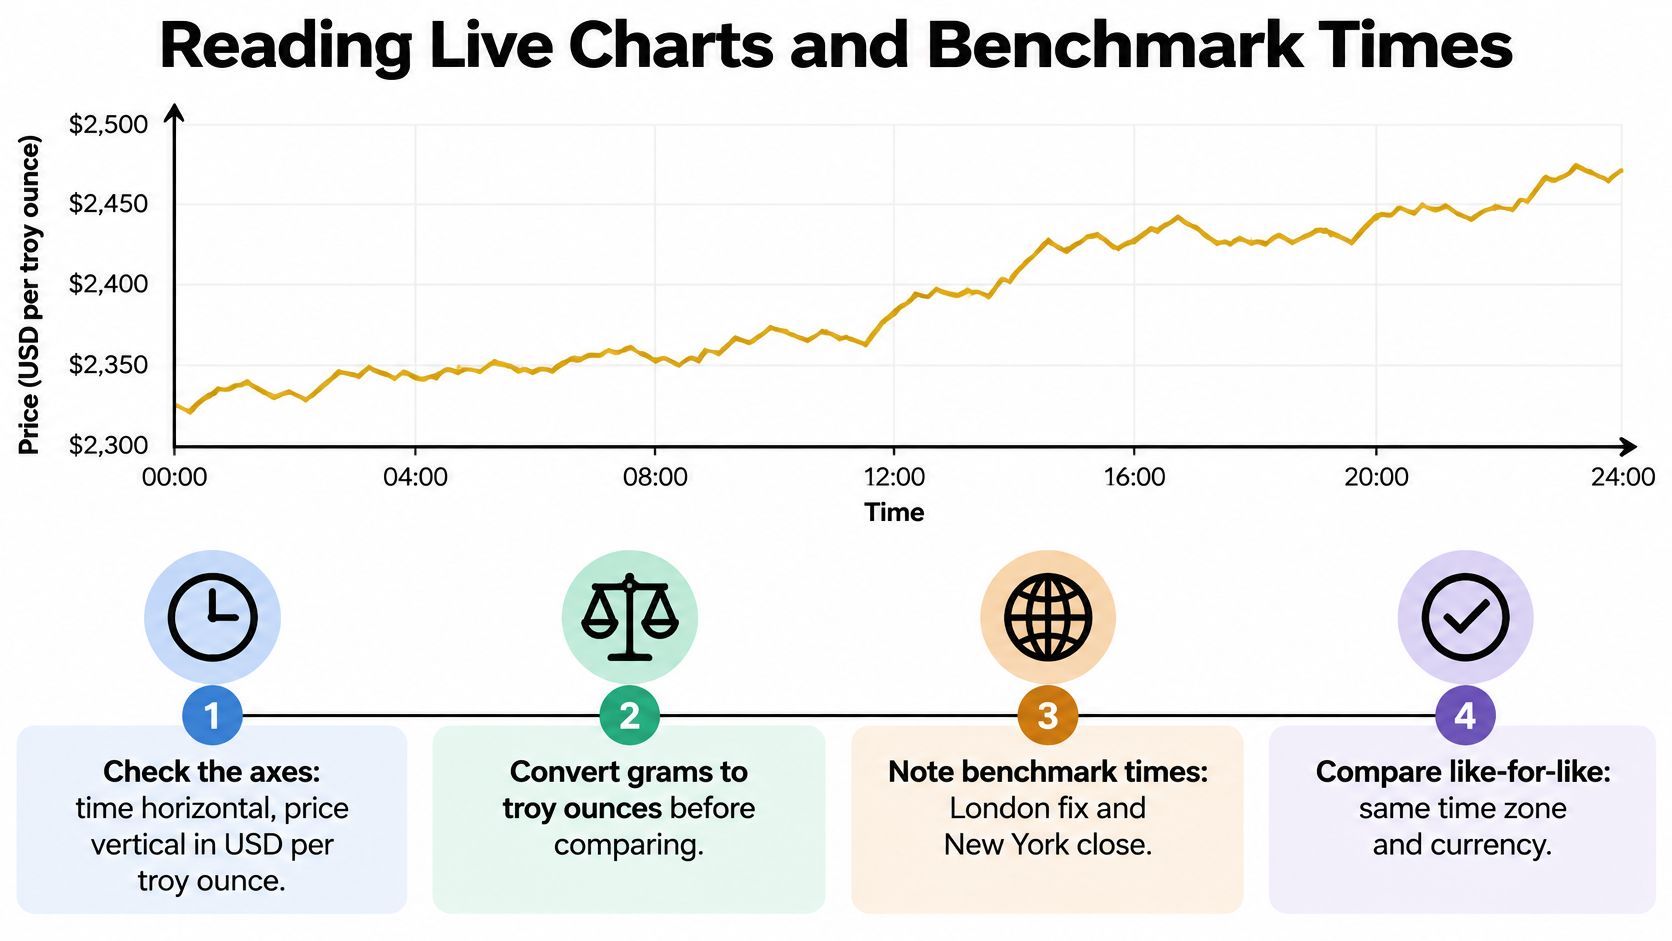
If your scale gives grams, convert them to troy ounces by dividing by 31.1035. A 100-gram bar contains about 3.215 troy ounces. Dividing by 28.35 instead gives 3.527 ounces, which overstates the true figure by roughly 10 percent.
A chart's short-term movement and longer trend answer different questions. An intraday move helps explain why a morning reading may differ from a counter offer later in the day. A multi-week view shows the broader direction, which can help you judge market movement over a planned repayment period.
The benchmark clock in Boise
London benchmark times fall early in Boise. Gold is set at 10:30 and 15:00 London time, about 3:30 a.m. and 8:00 a.m. in Boise. Silver is set at 12:00 London time, roughly 5:00 a.m. in Boise. By mid-morning, the latest benchmark is several hours old. A live chart may show more recent movement, so note its timestamp when comparing it with a benchmark.
A four-step reading routine
- Record the time of the reading. A price without a timestamp may no longer match the market when you compare it with an offer.
- Find the latest benchmark for gold or silver. Each metal has a separate benchmark.
- Review several weeks of daily movement. A broader view can put a sharp one-day rise or fall in context.
- Write the price and time beside the offer. This makes clear whether differences reflect timing or the type of price being compared.
Long-term charts also put short-term movement in perspective. Gold rose 612% from August 1999 to August 2011, then fell 42%, from $1,814 per ounce at the end of August 2011 to $1,060 in December 2015, according to the World Gold Council's review of gold's historical bear cycles. The review also records a 353% rise into November 1974, followed by a 43% fall to $104 by August 1976.
For ongoing local context, updated gold price charts and market insights show how prices change over time.
> Comparison rule: Put both readings in the same units and currency, and compare their timestamps. A chart benchmark and a Boise counter offer may refer to different times and different prices.
The chart shows market movement; the item and the terms of the offer determine what a seller receives.
How to Calculate What Your Gold or Silver Is Worth
A 2.5-gram 10k ring contains about 1.04 grams of pure gold, not 2.5 grams. The difference between the item's weight and its precious-metal content is the first part of estimating its value.
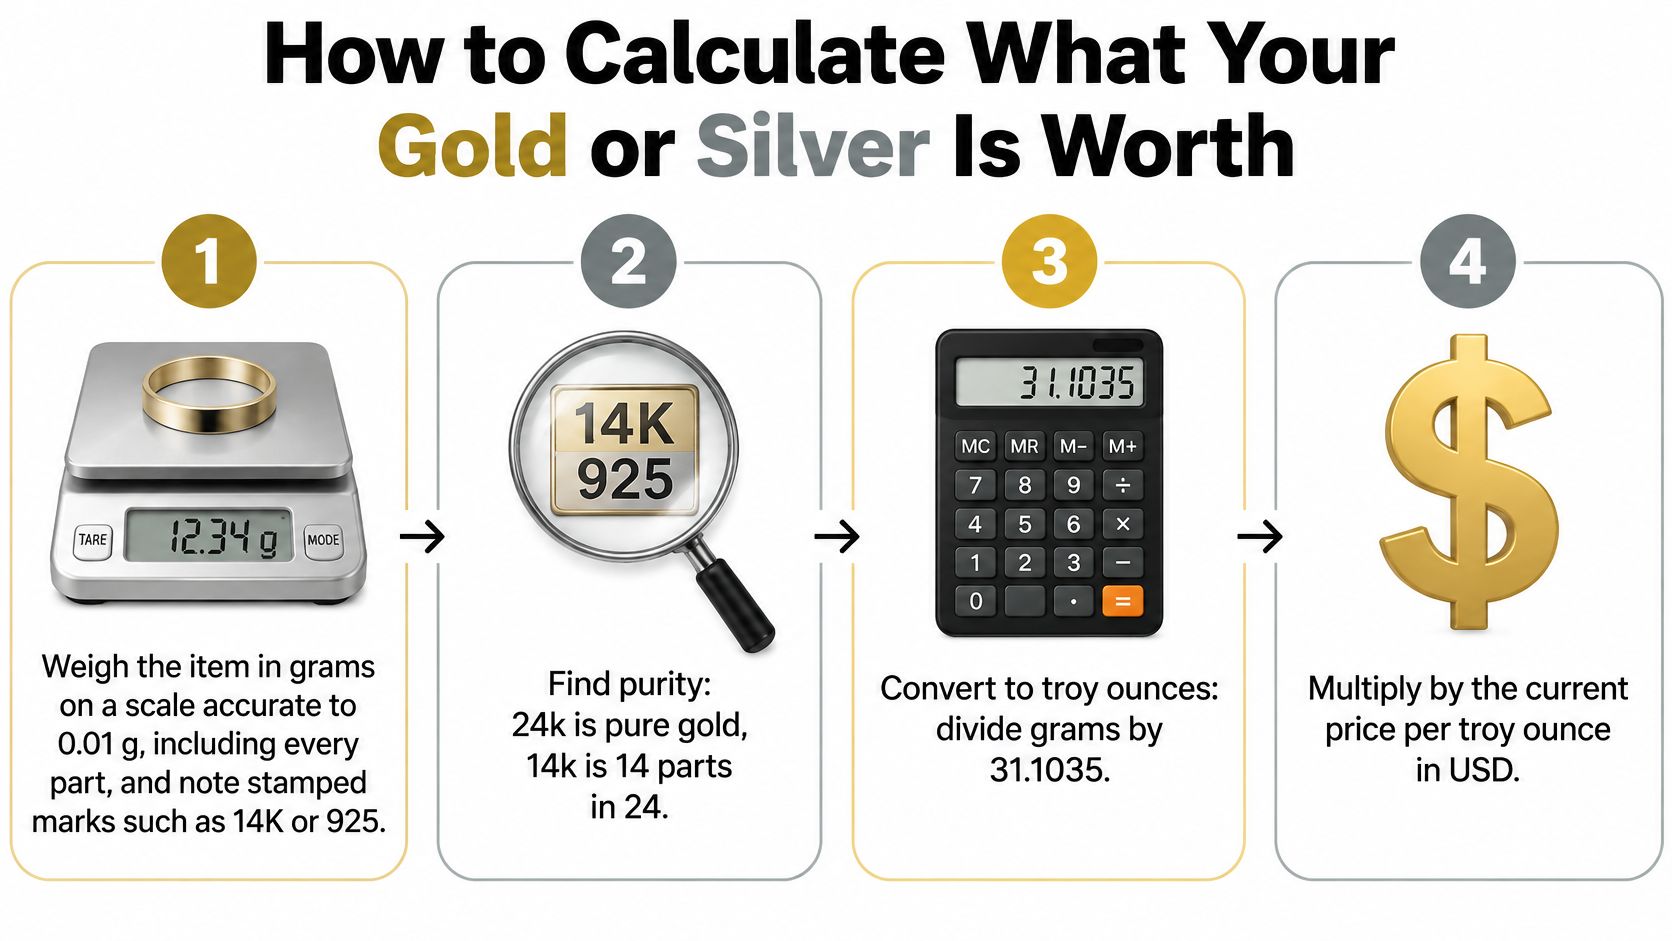
Six steps and the reason for each
- Weigh the piece in grams. Jewelry is usually weighed in grams and may include stones, clasps or solder. Those parts do not count as gold or silver, so a home estimate based on total weight can run high.
- Identify the stamp and its purity. 24k is the pure-gold reference. 14k means 14 parts gold out of 24, or about 58.5% gold by mass; 10k means 10 parts out of 24, or about 41.7%.
- Multiply weight by purity. This gives the weight of pure metal. For example, a 10k item's gold content is its weight multiplied by 10/24.
- Convert grams to troy ounces if the price is quoted per ounce. Divide the pure-metal weight in grams by 31.1035. A troy ounce is different from a standard kitchen ounce.
- Multiply pure-metal weight by the matching market price. Use the same metal and units, and note the time of the price reference.
- Apply the buyer's adjustment. A shop's buy price may differ from the metal's calculated value. The adjustment, whether a percentage or fixed amount, helps turn a metal-content estimate into an offer.
The LBMA's pricing and data guidance discusses benchmark prices and how precious metals are quoted. For a simple estimate, the arithmetic is: weight multiplied by purity, then multiplied by the price per unit of pure metal. A store's actual buy price can also reflect its pricing adjustments for that product.
A worked example on a 10k ring
Take a 2.5-gram 10k ring. Its gold content is 2.5 × (10/24), or about 1.04 grams of pure gold. Divide by 31.1035 to get about 0.0335 troy ounces. Gold closed the second quarter of 2025 at $3,287.45 per ounce, according to the LBMA's Q2 2025 market report. At that reference price, the ring's estimated gold content is worth about $110 before a buyer's adjustment.
For example, subtracting 10% from that estimate gives about $99; subtracting 20% gives about $88. Those are arithmetic examples, not standard adjustments. An actual offer depends on the buyer's pricing.
| Stamp | Metal | Pure metal share by mass |
|---|---|---|
| 24K | Gold | 100% |
| 18K | Gold | 75% |
| 14K | Gold | 58.5% |
| 10K | Gold | 41.7% |
| 925 | Silver | 92.5% |
A metal estimate is not the same as a jewelry retail price. A 2.5-gram 10k gold ring is listed for sale at $499.99 at the Nampa store. Its retail price includes more than the gold content, so comparing that tag directly with a melt estimate does not show what a seller would receive.
Silver follows the same calculation. A 10-gram bangle stamped 925 contains 10 × 0.925, or 9.25 grams of silver, about 0.297 troy ounces. Multiply that pure-silver weight by the matching silver price, then account for the buyer's adjustment. A silver-plated tray, by contrast, does not contain sterling silver throughout, so its total weight cannot be treated as 925 silver.
Why Gold and Silver Prices Move Differently
Gold and silver can react to the same market news, then move by different amounts. A headline price is only a benchmark: the metal's demand and market role help explain what changes that benchmark, while an item's form and the shop's pricing determine the eventual offer.
The World Bank's commodity markets outlook identifies higher bond yields, tighter monetary policy and a stronger U.S. dollar as pressures on precious metals. Safe-haven demand and central-bank gold purchases can support prices. These forces affect both metals, but not always equally.
Where the drivers divide
Gold demand is closely tied to investment, reserves and expectations about money. Silver also has a monetary role, but industrial uses, including renewable-energy applications, make its price more sensitive to changes in manufacturing and broader economic activity.
| Driver | Gold | Silver |
|---|---|---|
| Higher bond yields, tighter policy | Can pressure prices | Can pressure prices, with larger percentage swings |
| Stronger U.S. dollar | Can pressure prices | Can pressure prices |
| Safe-haven demand, central-bank buying | Can support prices | Safe-haven demand can support prices; industrial use also matters |
| Renewable energy and industrial demand | Limited direct role | Can support prices and increase sensitivity to economic cycles |
| Constrained supply | A less direct influence | Can support prices |
That difference matters when a shop checks prices. Gold and silver need separate, current market references; a fixed gold-to-silver ratio cannot account for how differently their prices may move. Silver can shift more sharply during a trading session, so yesterday's ratio may not describe today's market.
Exchange futures also use standard contract sizes that differ by metal. Those contracts serve large-scale trading, not as a direct measure of what an individual ring or coin will bring. To understand a local offer, follow the benchmark through the item's metal content and the store's buy price; the amount paid to a seller is not the same as a live chart price.
For a closer look at the forces behind local quotes, read about why gold prices fluctuate in Idaho. Gold and silver are related markets, but their prices do not move in lockstep.
Premiums and Spreads on Coins and Bars
The $2 Goldback has the widest percentage spread on Idaho Pawn & Gold Exchange's price sheet. The small Goldbacks as a group have much wider percentage gaps than the one ounce coins.
A premium is the amount paid above a metal's benchmark price for a finished product. It can reflect minting, fabrication, packaging, distribution and dealer margin. A spread is the difference between a store's buy price and sell price. Smaller pieces can have a wider spread because production and handling costs are divided across less metal.
| Product | Store buy | Store sell | Spread | Spread as % of buy |
|---|---|---|---|---|
| $1 Goldback (0.0311 g, 0.999 fine) | $3.72 | $6.23 | $2.51 | 67% |
| $2 Goldback (0.0622 g, 0.999 fine) | $7.44 | $12.85 | $5.41 | 73% |
| $5 Goldback (0.155 g, 0.999 fine) | $20.58 | $33.00 | $12.42 | 60% |
| Mexican Libertad 1 oz (0.999 fine) | $45.40 | $53.90 | $8.50 | 19% |
| Eagle 1 oz (0.999 fine) | $45.90 | $52.90 | $7.00 | 15% |
| Britannia 1 oz (0.999 fine) | $45.40 | $52.40 | $7.00 | 15% |
The last column compares each gap with the store buy price. For the $2 Goldback, the $5.41 spread is about 73% of its $7.44 buy price. The one ounce coins have percentage spreads of 15% to 19%. Compare like with like: the Goldbacks are small fabricated pieces, while the coins contain a full ounce.
Silver shows a different pattern in dollar terms. Idaho Pawn & Gold Exchange's 90% silver coin reference prices are $29.33 buy and $35.76 sell per $1 face value, a $6.43 spread. Sterling flatware is listed at $30.03 buy and $46.20 sell per troy ounce, a $16.17 spread. These figures use different units, so compare each product within its own unit rather than treating the dollar gaps as directly equivalent.
A market-wide silver supply deficit does not set the premium on an individual coin or determine what sterling flatware will bring. The Silver Institute's World Silver Survey 2025 projected a fifth consecutive structural market deficit of 117.6 million ounces and reported expected industrial demand growth of 3% to 44.1 million ounces in its stated category. Broad supply and demand figures describe the market; a shop's product prices also reflect the item and its form.
Habit worth building: compare products using the same metal basis, then compare their spread percentages. A smaller percentage spread generally means a smaller gap between the listed buy and sell prices.
How Pawn Shops Value and Price Your Items
The highest number on the table isn't always the best outcome. An offer that arrives after a week of shipping, an uncertain assay or a deduction disclosed at the end can leave you with less than a lower quote paid on the spot, and that's before you count the risk of a parcel going missing.
Three numbers run under every conversation at the counter. Melt value is metal content multiplied by the benchmark. The buy adjustment is the shop's percentage or fixed deduction from that. Resale value is what the piece can sell for, and on collectible or branded luxury pieces it can sit well above melt, which is why a designer handbag or a signed watch shouldn't be priced by weight at all.
A high price can even work against a seller. The World Gold Council reported that Q3 2026 jewelry demand fell 17% year over year to 313 tonnes while gold averaged US$4,262 per ounce, showing that high prices can discourage buyers and thin the market for finished jewelry, as the World Gold Council's Q3 demand release sets out. Bullion stays liquid in that environment. A fashion ring does not.
That's why purity gets tested rather than trusted. We use an XRF analyzer that gives lab quality results on gold and silver, so a stamp that says 14k and a piece that reads 13.2k get priced differently, and you see which one you own before you decide anything.
| Option | Do you keep the item? | Main cost | How the amount is set |
|---|---|---|---|
| Pawn loan | Yes, if you repay by the deadline | Interest, with pawn APR as low as 35 percent | Loan against the item's value |
| Outright sale | No | Shop margin built into the offer | Offer based on melt or resale value |
A pawn is a short-term cash loan in which you hand over an item as collateral. You keep the right to reclaim it, and you take on interest and a repayment deadline in exchange. That trade is worth making when you need cash now and want the piece back, and it's the wrong tool when you're ready to part with the item. Our walkthrough on selling scrap gold at a pawn shop covers the sale side step by step.
Bring three things to a Boise, Meridian or Nampa counter: the item itself, any stamps, papers or receipts that support its purity or brand, and a clear figure for how much cash you need and when you can repay it.
Get a Free Scan Before You Sell or Pledge
A free precious metal scan can help you replace a guess with a tested result before deciding what to do with an item.
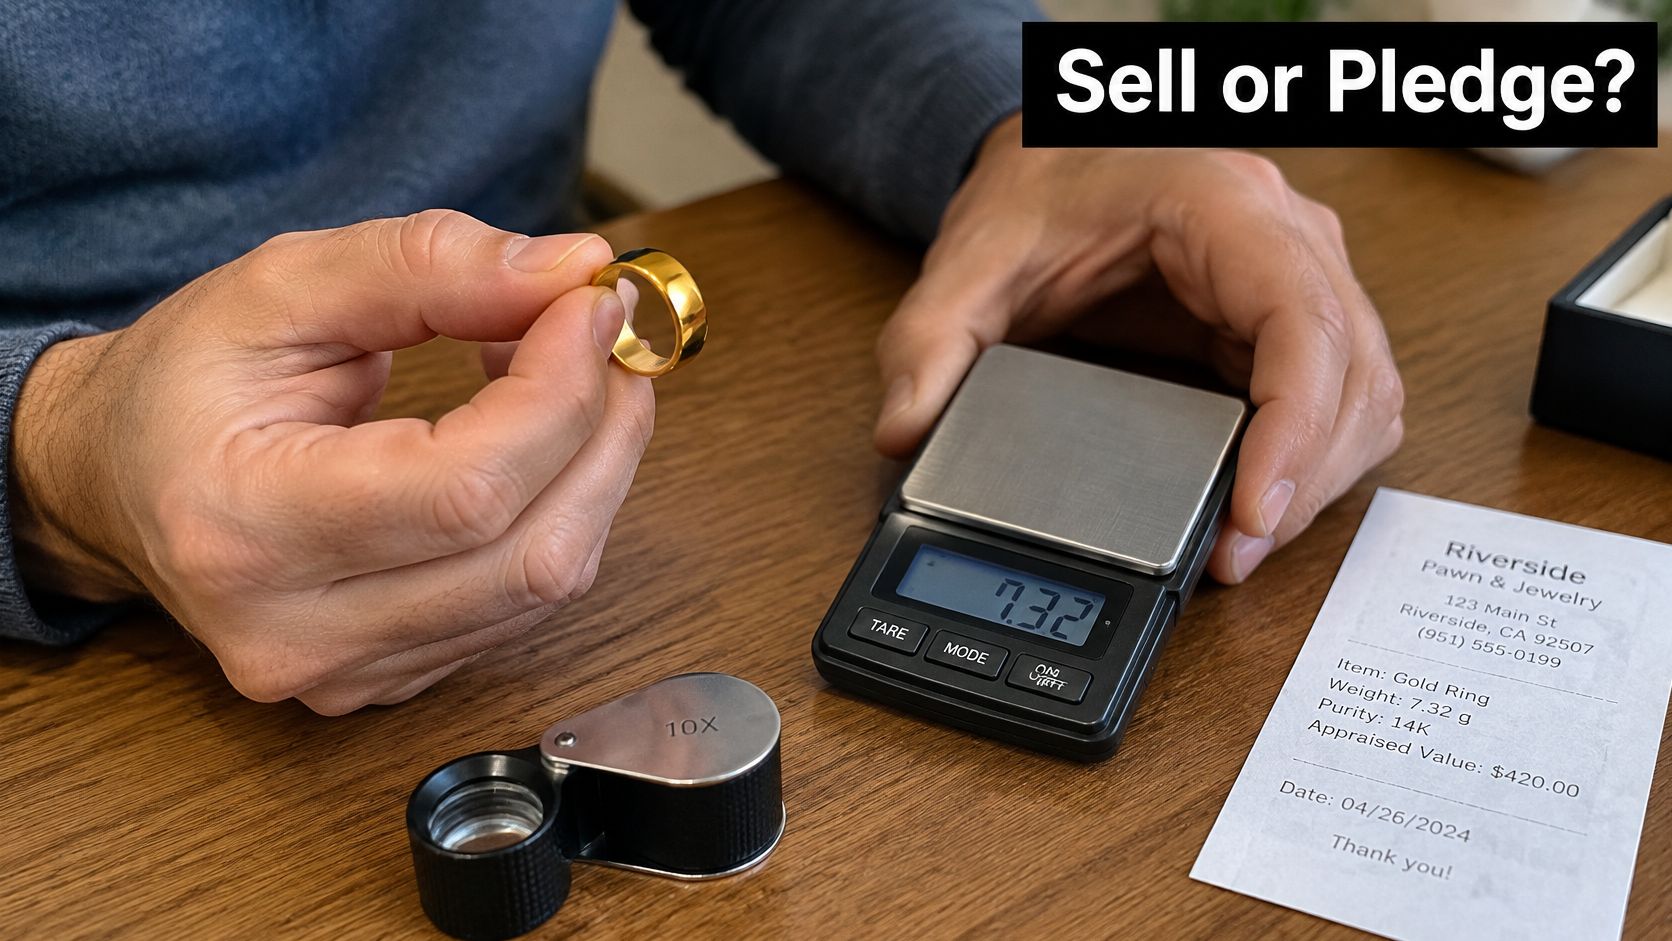
Use three questions to guide your choice:
- Sell if you need cash and do not want a repayment obligation. Compare the offer with your estimate of the metal's value, allowing for the difference between a market reference price and a store's buy price.
- Pawn if you want the item back and can repay the loan and interest by the deadline. Put the repayment date on your calendar.
- Hold if you do not need cash now and can wait through price changes.
Idaho Pawn & Gold offers free precious metal scans and tests gold and silver with an XRF analyzer that gives lab-quality results. After the scan, ask staff to explain how an offer is calculated. The estimate depends on weight, tested purity and a market reference in the same units, while the amount offered may also reflect product-specific buy-price adjustments.
Idaho Pawn & Gold buys thousands of ounces of gold and silver a month and offers the most percentage of spot price for gold in the Treasure Valley. To compare offers, use the same item and metal basis for each quote. Your cash deadline matters, too: can you repay a pawn loan before its due date, or is an outright sale a better fit?
Bring your ring, coins, flatware or bullion to Idaho Pawn & Gold in Boise, Meridian or Nampa for a free scan before you decide whether to sell or pawn. Visit Idaho Pawn & Gold Exchange to see the current buy and sell prices on the public sheet.